
Introduction
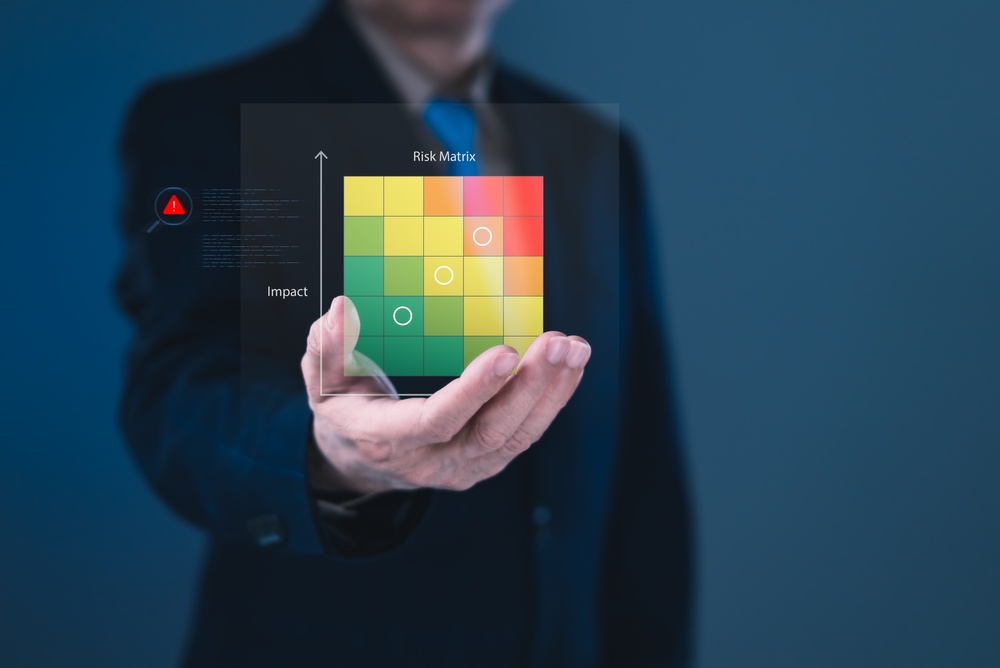
Ask most safety professionals to name their go-to tool for prioritising hazards, and the risk matrix comes up almost immediately. It works by comparing how likely an event is against how bad the consequences would be, which gives organisations a consistent way to decide where controls are needed most. That approach has held up for decades, and it's held up because it works: it gives people across very different industries and environments a shared, repeatable way to size up risk.
Where it falls short is explaining why incidents still happen even when the hazards have been identified and the right controls are sitting in place. That gap is what this article gets into: how risk matrices work, where they run into limits, and why the human factors behind performance need to be part of the picture too.
What Is a Risk Matrix?
Strip it back and a risk matrix is really just two questions. How likely is this event? And if it happens, how bad will it be?
Those two dimensions get plotted on a colour-coded grid, usually in a 3×3, 4×4 or 5×5 format. Every hazard gets a likelihood score and a severity score, and together they produce an overall risk rating. The higher that number, the more urgently controls need strengthening.
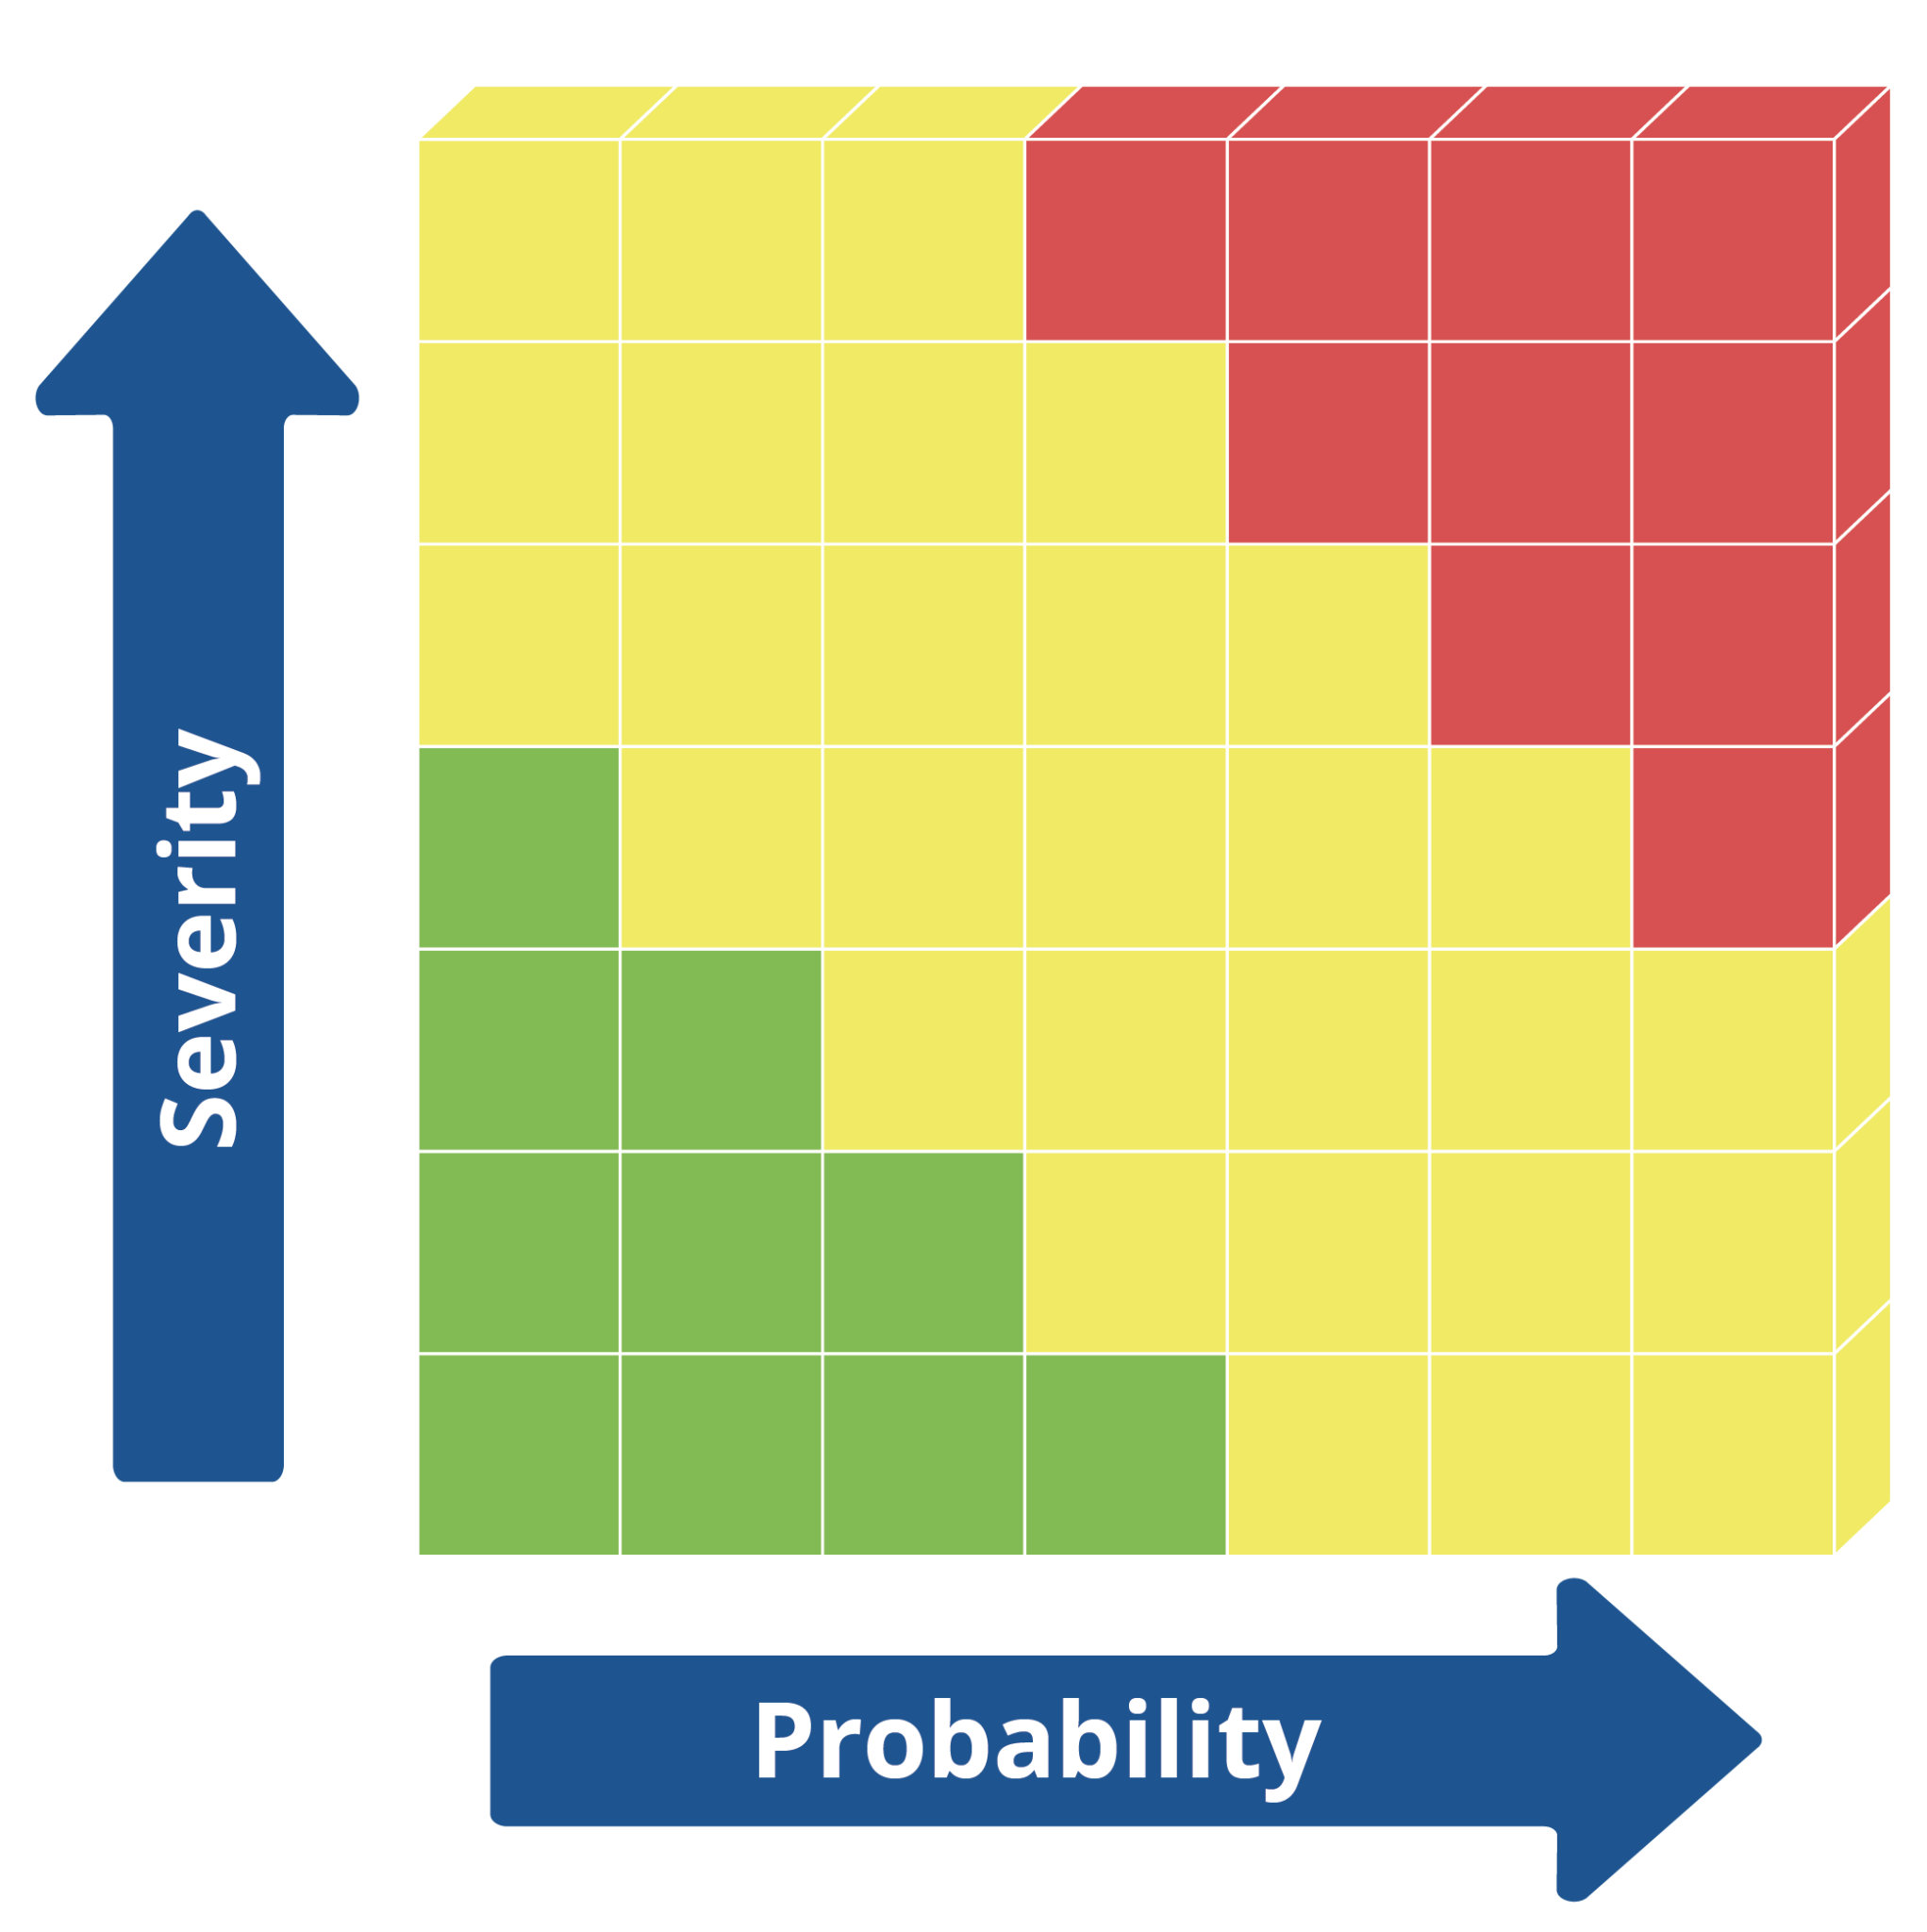
Because of their simplicity and consistency, risk matrices are used across virtually every industry, from manufacturing and construction to healthcare and logistics. Regardless of the format, their purpose is the same: to help organisations evaluate hazards consistently and determine where control measures should be focused.
Why Risk Matrices Matter in Workplace Safety
Every day, a risk matrix is quietly behind hundreds of decisions: which maintenance job gets done first, whether a task needs an extra safeguard before it starts, how resources get split, and when a risk is acceptable versus when it needs more work.
It also gives people a shared language. An engineer, a supervisor and a frontline worker won't always see a task the same way, but the matrix forces that conversation into a structured shape everyone can work with. Used properly, it does more than generate paperwork. It gets teams questioning assumptions and agreeing on controls before anyone picks up a tool.
Risk Matrix vs Risk Assessment Matrix
People tend to use "risk matrix" and "risk assessment matrix" interchangeably, and in practice that's fine. Technically, the matrix is just the scoring tool, while the risk assessment is the broader process: identifying hazards, evaluating them and landing on the right controls.
For most organisations, though, that distinction matters less than a bigger question: does the assessment actually capture everything that drives risk, including the human factors that make an incident more or less likely on any given day?
How to Calculate a Risk Matrix Score
Scales differ slightly from one organisation to the next, but the underlying logic is consistent. You score two things:
- Likelihood: how likely is the event?
- Severity: how serious are the consequences if it happens?
Most organisations score each from 1 to 5, with higher numbers meaning greater likelihood or worse consequences. Multiply the two together and you get the overall risk rating.
Take a forklift working a busy warehouse floor as an example.
Risk Score = 3 × 4 = 12
That number tells you whether the current controls are enough or whether something else needs to be added. The exact scoring criteria will vary by organisation, but the principle holds everywhere: combine likelihood and severity, and you get a structured way to compare risks that otherwise look completely unrelated.
Types of Risk Matrices
Risk matrices come in different sizes, but they all work in the same way by comparing likelihood and severity.
.png)
3×3 Risk Matrix
3×3 is the simplest version, using three levels each for likelihood and severity. It's fast to apply and works well for lower-risk activities.
4×4 Risk Matrix
4×4 adds detail without adding much complexity, striking a decent balance between simplicity and accuracy.
5×5 Risk Matrix
5×5 is the most widely used format, and it offers the most granularity, which makes it better suited to complex or higher-risk operations.
Initial Risk vs Residual Risk
Risk matrices are also used to track how risk changes once controls go in. Initial risk (or inherent risk) is what exists before any controls are applied. Residual risk is what's left once engineering measures, safe work procedures, training or PPE have done their job.
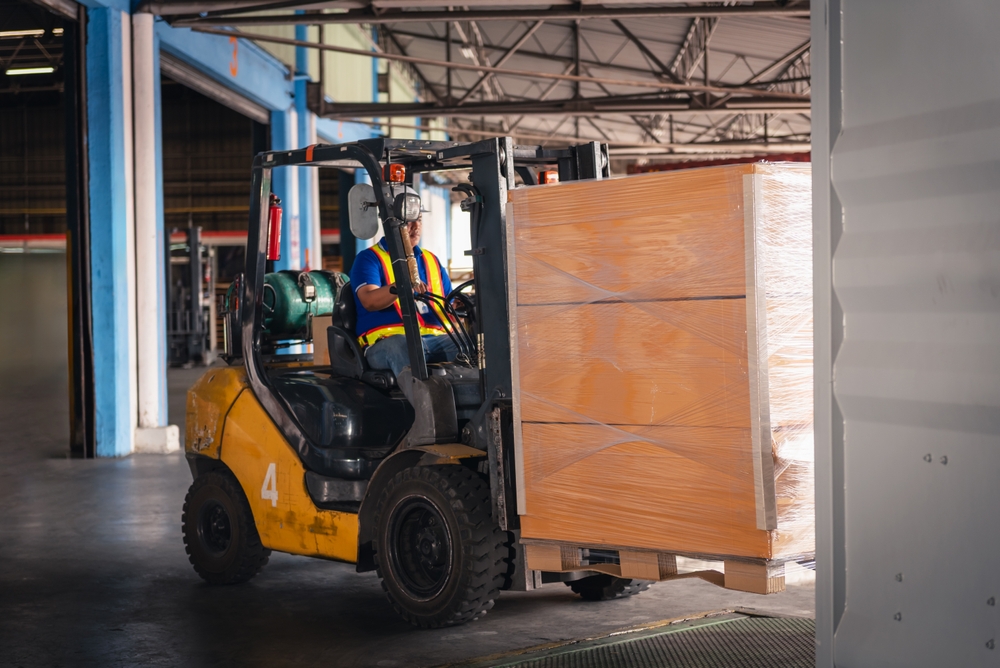
Go back to the forklift in the warehouse. Left unmanaged, that task carries a high initial risk. Add designated traffic routes, proper operator training and speed limits, and the residual risk drops considerably.
Comparing the two numbers is how organisations judge whether existing controls are actually doing enough, or whether something more is needed before work starts.
Limitations of Risk Matrices
No model is perfect, and risk matrices have a couple of well-known blind spots. The first is that likelihood scores lean heavily on judgement. Hand the same task to two different assessors and you'll often get two different scores, shaped by each person's experience and how they read the situation in front of them.
The second is timing. A risk matrix captures a single moment: the hazards, controls and assumptions that existed when someone filled it in. Workplaces don't stay that still. Production demands shift, equipment wears down, new hazards appear, and, as we'll get into, a person's ability to work safely changes too, depending on whether they're fatigued, rushing, frustrated or just coasting on autopilot.
None of this makes the traditional risk matrix wrong or incomplete. It just means assessments need revisiting regularly, and it's worth remembering that the likelihood of an incident comes from two directions at once: the task itself, and the human factors surrounding it. Put those two views together and you get a much fuller picture of what's actually driving risk.
Why the Traditional Model Doesn't Tell the Whole Story
One of the most thought-provoking ways to understand this concept comes from a simple exercise developed by Larry Wilson.
Think about the most dangerous thing you've ever done. It might have been driving at very high speed, climbing a mountain, scuba diving or working at height. Now think about the most serious injury you've ever experienced.
For most people, those two events don't match. In fact, when Larry Wilson asks this question during presentations, only a small percentage of participants say their worst injury happened while doing the most dangerous thing they had ever attempted. At first, this seems counterintuitive. If our highest-risk activities carry the greatest danger, shouldn't they also produce our most serious injuries?
Here's the thing: obvious danger changes how we behave. When something clearly reads as high risk, we sharpen up. We slow down, pay closer attention and actively manage the hazards in front of us, because we know exactly what's at stake.
Routine work doesn't get that same treatment. Familiarity wears down vigilance over time, especially once fatigue, rushing or frustration creep in, or a person's simply running on autopilot. The hazard hasn't changed from yesterday, but the odds of making a critical error just went up. That's the gap traditional risk matrices miss: likelihood isn't just about the task. It's also about the state of the person doing it.
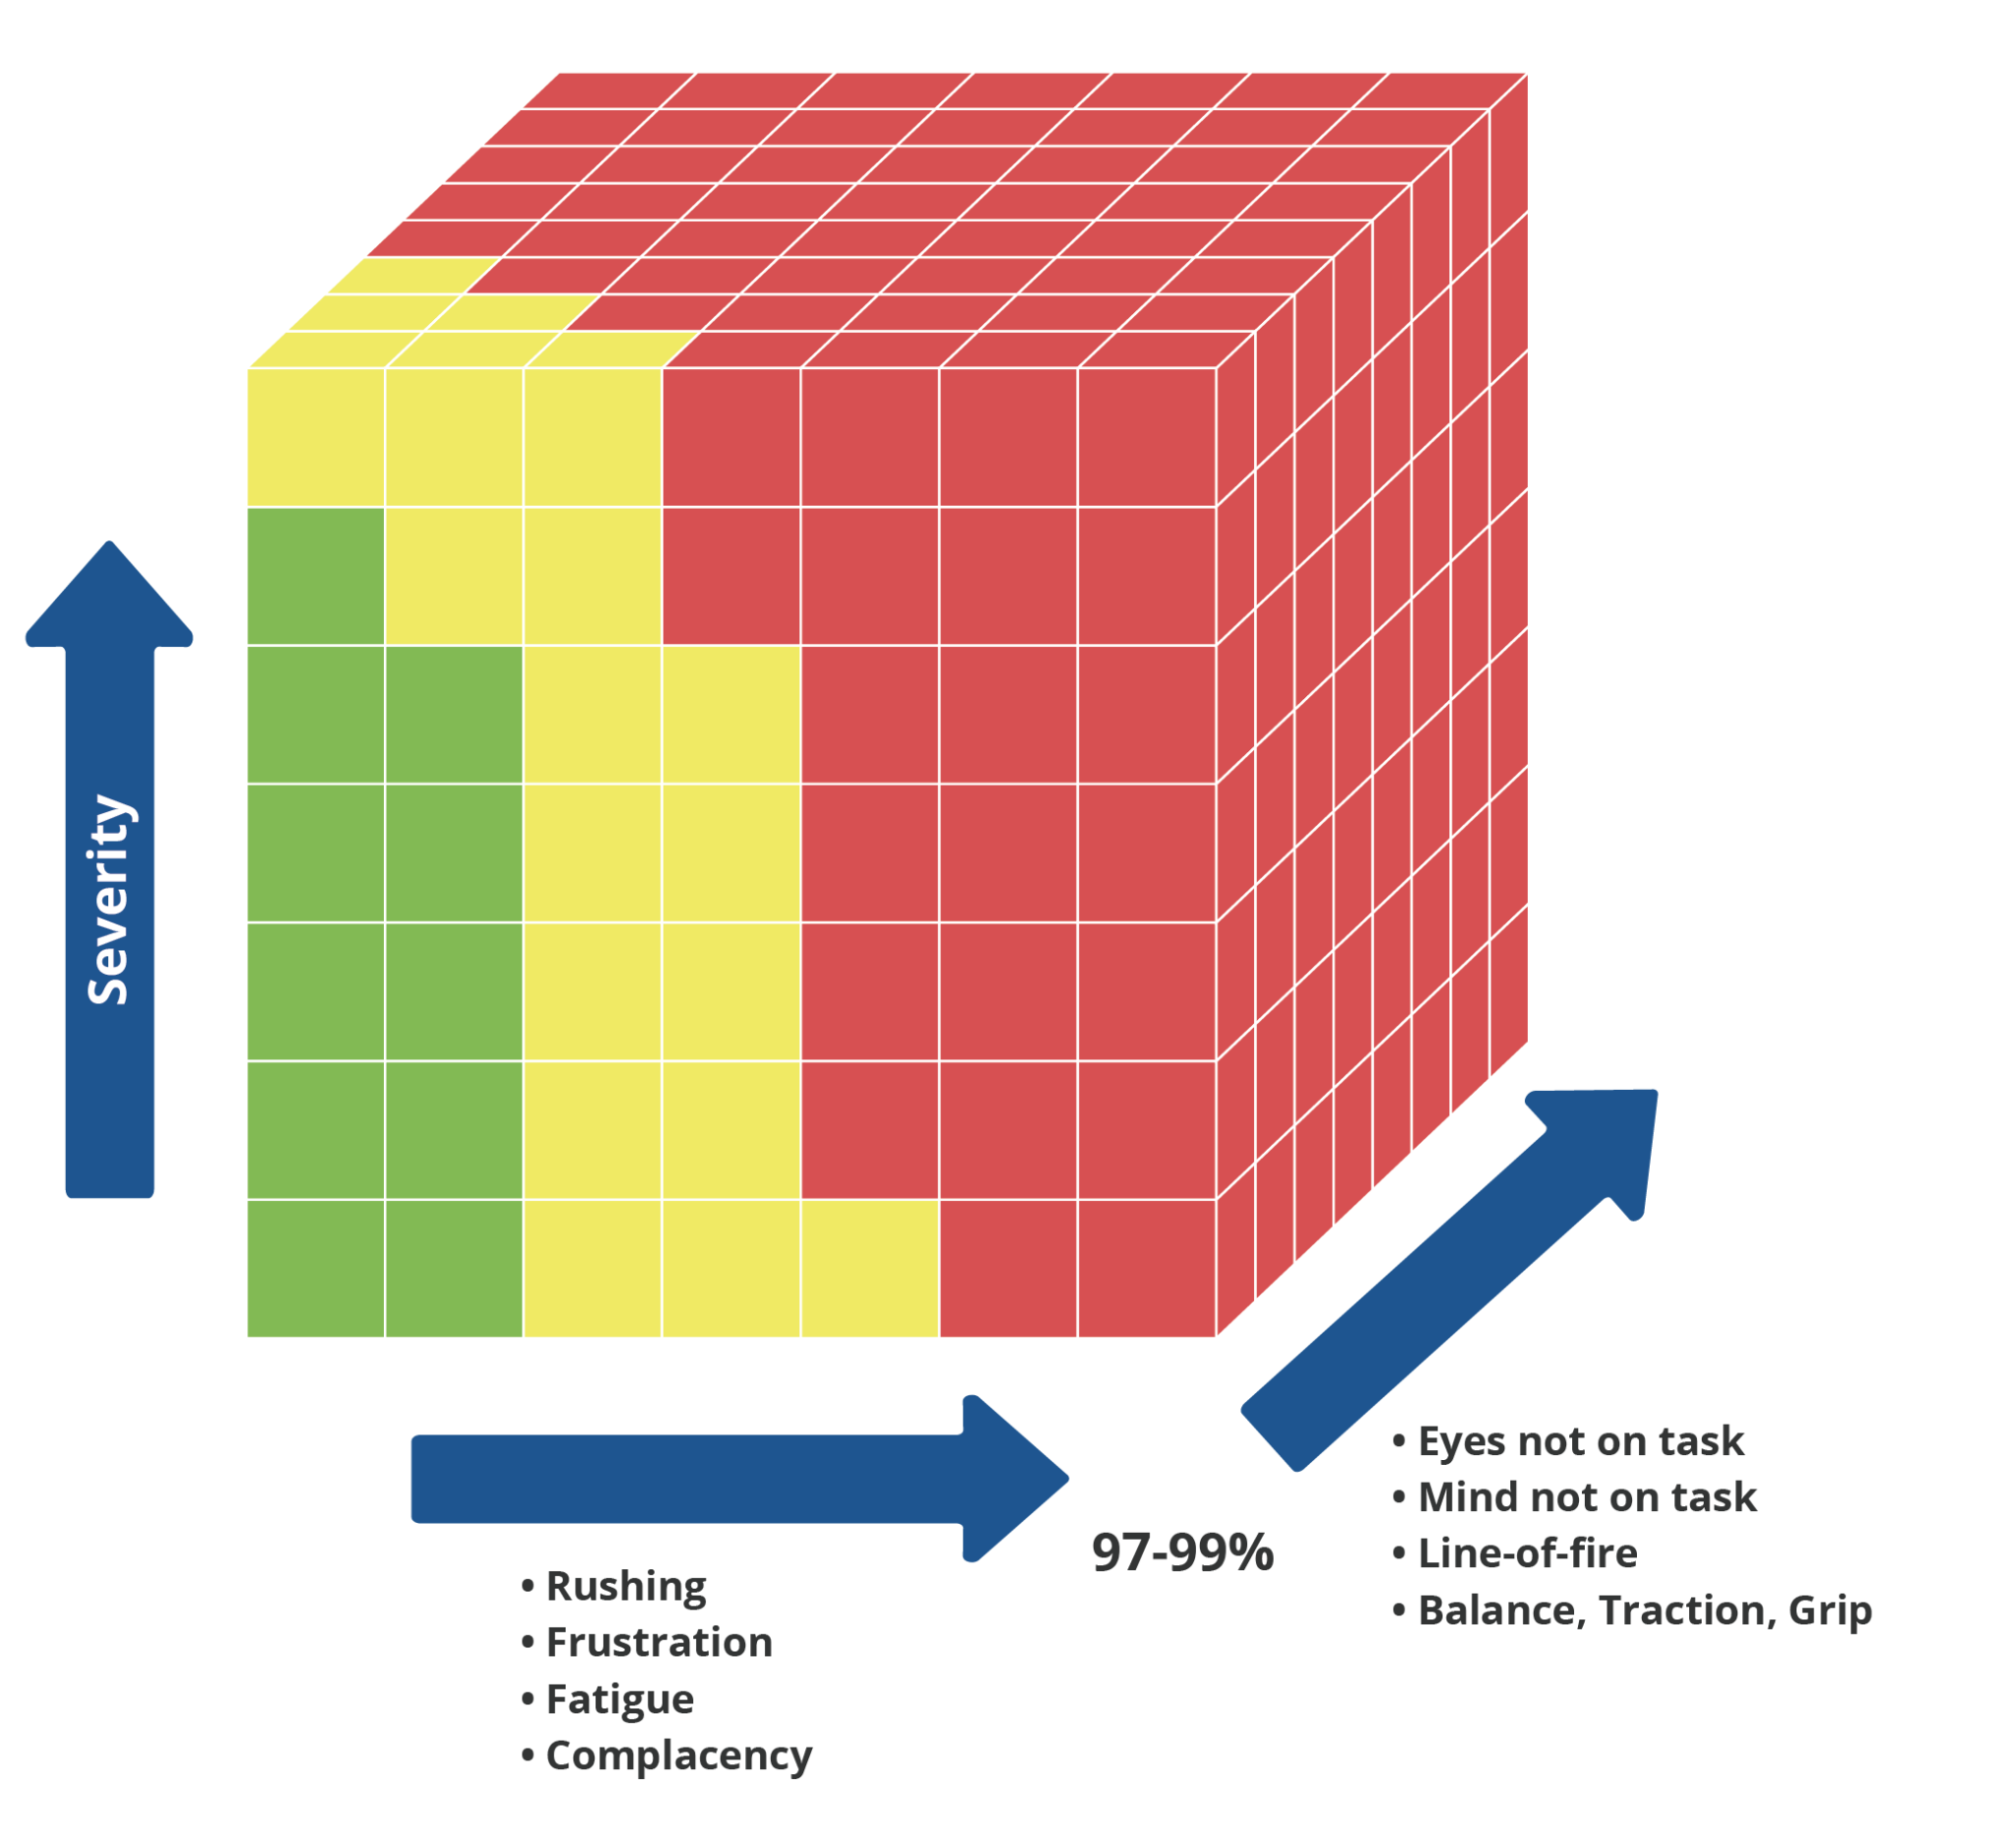
Adding a Third Dimension to Risk Assessment
Larry Wilson uses this exercise to illustrate what he calls the third dimension of risk assessment. Standard risk matrices score likelihood and severity, but neither of those explicitly accounts for the human factors that shift how likely a critical error actually is.
This isn't about replacing the traditional model. It builds on it, by recognising that even when the task, the equipment and the controls stay exactly the same, a person's ability to perform safely still moves around throughout the day.
What Happens When We Add the Third Dimension?
Back to the forklift. The operator's trained properly, the vehicle's maintained, the traffic routes are marked out, and every control measure is doing its job. On paper, a likelihood score of 3 looks about right.
But what happens a few hours into the shift, once that same operator is mentally fatigued, rushing to finish a last delivery before end of day, or worn down by one interruption too many?
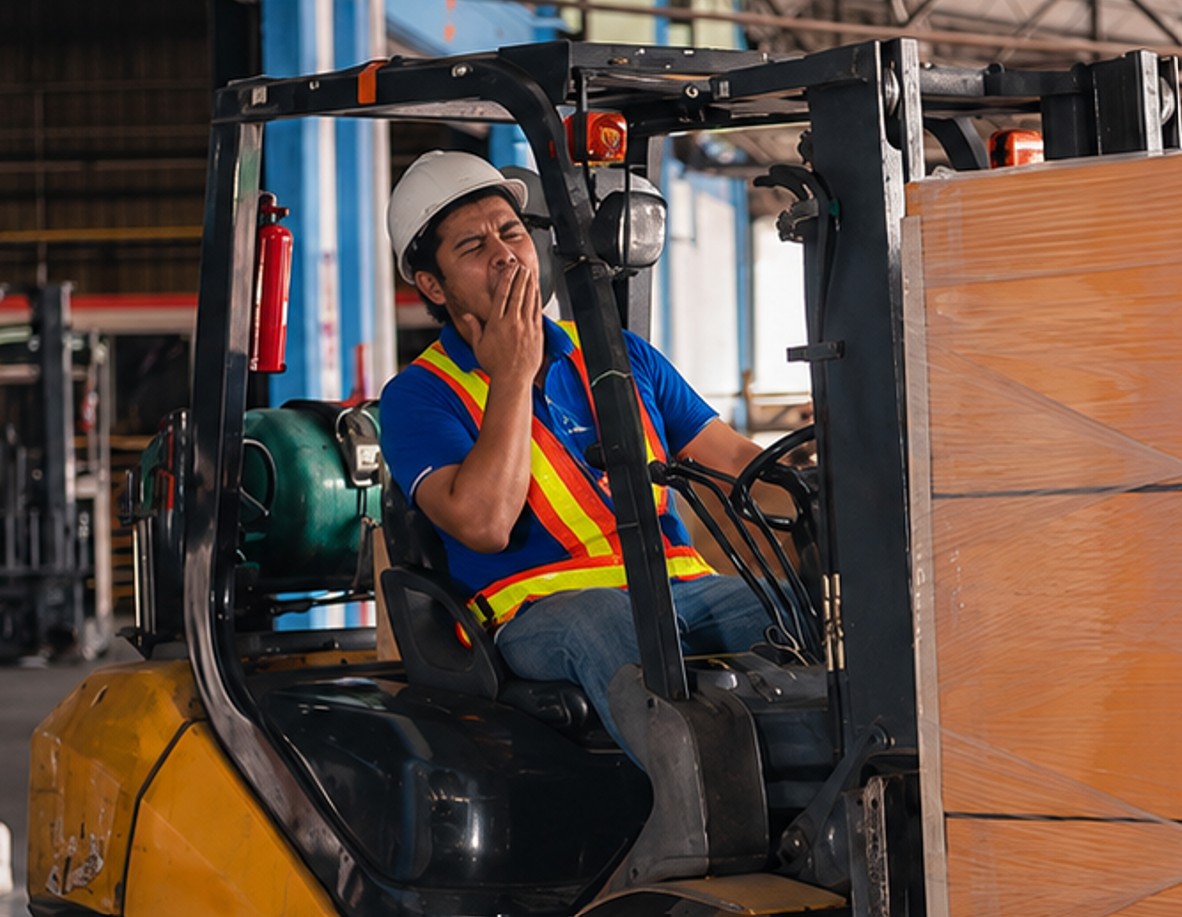
Nothing about the forklift has changed. The warehouse layout's the same, the traffic management hasn't moved, and the controls are still exactly where they were. And yet most safety professionals would agree the likelihood of something going wrong has gone up, because the operator's ability to do the task safely has shifted.
A traditional risk matrix won't pick that up. It tends to treat the likelihood score as fixed to the task, when in reality human performance moves throughout the working day. That's the whole point of the third dimension: it doesn't replace likelihood and severity, it adds to them, by recognising that what drives an incident is the task and its controls, plus whatever's going on for the person doing it in that moment.
Conclusion
A risk matrix still earns its place as one of the most useful tools in workplace safety. It gives organisations a structured way to assess hazards, prioritise where resources go, and decide on controls before work starts.
But risk isn't static. Production pressures shift, new hazards turn up, and people's ability to perform safely moves around from one hour to the next. By the time a task is actually underway, the real level of risk may already look different from what the original assessment captured.
That's why more organisations are looking past the traditional matrix, not to replace it, but to build on it, by paying attention to the human factors that shape performance in real time. The strongest safety programmes do both: they assess the risk in the task itself, and they help people notice the changing conditions, self-triggers, rushing, fatigue, frustration, complacency, that raise the odds of a critical error before it happens.
Published on 29.07.2026
.jpg)
%20(1).jpg)